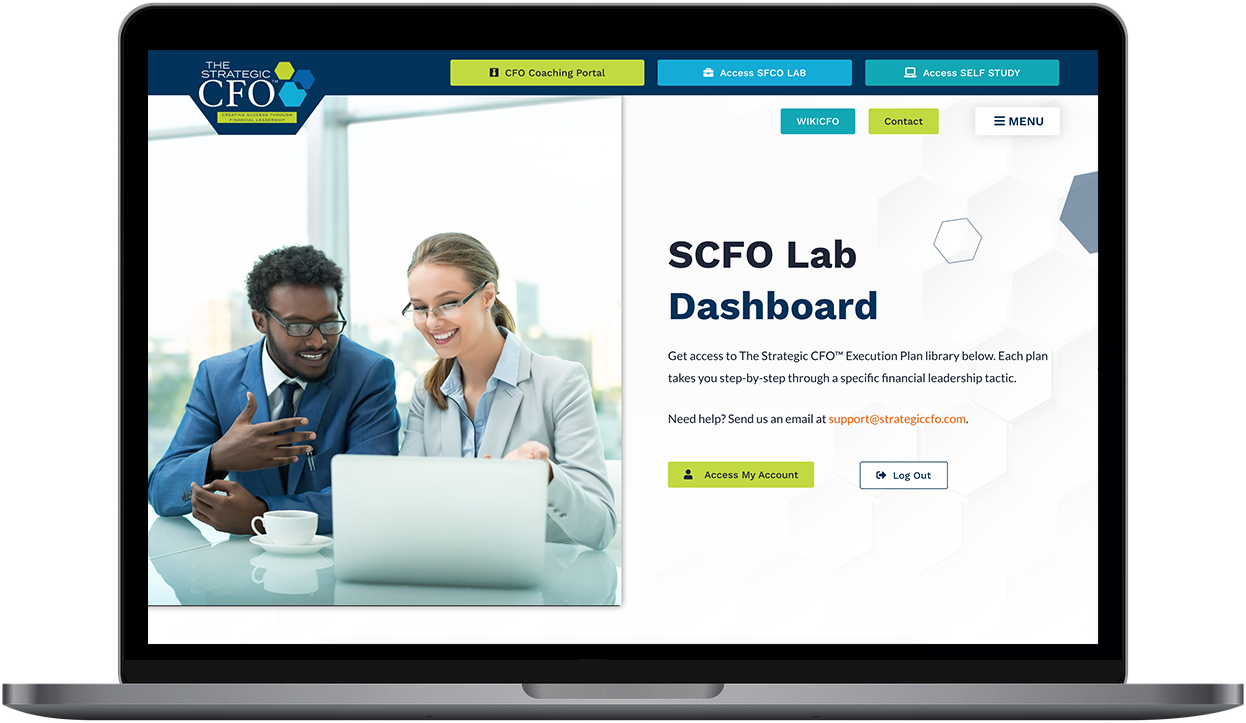
Data analysis in Excel made easy

QuickRows is an “add-in” that totally recreates how you analyze data in Excel. Access QuickRows to learn how you can create complex pivot tables and perform data analytics. All without writing a single formula
$47.90/ Monthly
$497 Yearly
Analyze data and extract desired data in seconds without writing formulas or applying filters.

Pivot Tables, Filters, VLOOKUP are all great functions within Excel. But you need to be an intermediate to advanced user to take full advantage of them. And they do take time to create, test and debug…

Not anymore. With QuickRows create Pivot Tables with a couple clicks. No need to remember complicated steps and parameters! Extract desired data in seconds, without writing formulas or applying filters.

Use Quick Rows and within a couple clicks manipulate your data

Lorem ipsum dolor sit amet, consectetur adipiscing elit. Ut elit tellus, luctus nec ullamcorper mattis, pulvinar dapibus leo.

Sort, Clean & Standardize

your Information

Find & Cluster

what you want in tables and ranges

Analyze & Segment

your database

Data Analysis Made Easy!

No more formulas needed to achieve fast results in Excel with QuickRows.

Now even a basic user of Excel can create powerful Pivot Tables and analyze data in seconds for a low price of $4.99/month!
Save dozens of hours because you no longer need to write formulas when analyzing your data.

QuickRows: Data Analysis made easy
Video Walkthroughs
Video Walkthroughs
1/5 videos
QuickRows: Data Analysis made easy
Quick analysis of tables
01:51
How to select rows and create a new listing tutorial
02:59
How to configure double-click actions
03:05
Row Selection
Row Selection
04:42
Learn How To Establish A Flash Report

This is the key to growing your company profitably. The Strategic CFO™ Flash Report Tool enables you to react quickly, focus on what really matters, and lead your company towards a better financial future.

Get the Flash Report
$59
$ 10
  • This tool is usually reserved for SCFO Lab Members only.
LIMITED TIME
ALSO INCLUDED IN
SCFO Lab Membership
$ 47
90
Month
  • Get access to Flash Report and All Our Tools That Have Been Curated Over the Last 25+ Years
Our #1 Tool We Use With Every Client

Use the flash report tool to monitor, identify, and communicate key financial/operational data with your entire management team. You’ll also have access to a detailed guide on each section of the Flash Report.

React Quicker

Don’t wait on financial statements any longer! Run your company in real time so you can react quicker.

Focus On What Matters

Identify your KPIs to narrow down what really matters. Use the Flash Report Tool to measure KPIs over time.

Bring Everyone To The Table

Lead your team to the same goal. Think proactively. Make changes in your company based on KPI trends that you otherwise wouldn’t see coming.

Why Put Off Measuring Your Company’s Success?
You can buy The Strategic CFO™ Flash Report Tool right now for only $10.

Typically, the Flash Report Tool is only available to our SCFO Lab members and consulting clients. We make resources like this one available for limited periods of time.

Improve Profitability With The Flux Analysis Tool

Identify areas of improvement using years of financial history. The Flux Analysis Report creates a framework in which you can improve the profitability of your company.

The Strategic CFO™ Flux Analysis Tool enables you to easily determine the profitability of your company’s products & services down to the net income level.

Get the Flux Analysis
$59
$ 9
  • This tool is usually reserved for SCFO Lab Members only.
LIMITED TIME
ALSO INCLUDED IN
SCFO Lab Membership
$ 47
90
Month
  • Get access to Flux Analysis and All Our Tools That Have Been Curated Over the Last 25+ Years
What The Flux Analysis Tool Includes
Excel Spreadsheet
Flash Report Guide
PLUS an opportunity to join our exclusive SCFO Lab – the premier financial leadership training platform with over 19 execution plans just like this Flux Analysis.

Improve Results In
4 Simple Steps

STEP 1

Read through our "How to Be a Wingman Guide" and identify areas of improvement for your company.

STEP 2

Use the Flux Analysis Tool to measure and compare quarterly or annual financial results to other periods.

STEP 3

Develop a plan to improve profitability and execute. You'll get others on board since you've calculated the benefit already.

STEP 4

​Keep track of change over time through financial reporting and review your results for future action.

Limited Time Offer & Discount

Typically the Flux Analysis Tool is only available to SCFO Lab members and clients in our CFO Coaching Workshops. We make resources like this one available for limited periods to demonstrate the value of our courses.

JOIN THE NEXT STRATEGIC CFO™ SERIES

Strategic CFO™ Financial Leadership Workshop
The Art of the CFO®

Days
Hours
Min
Sec

September 12-15th 2022